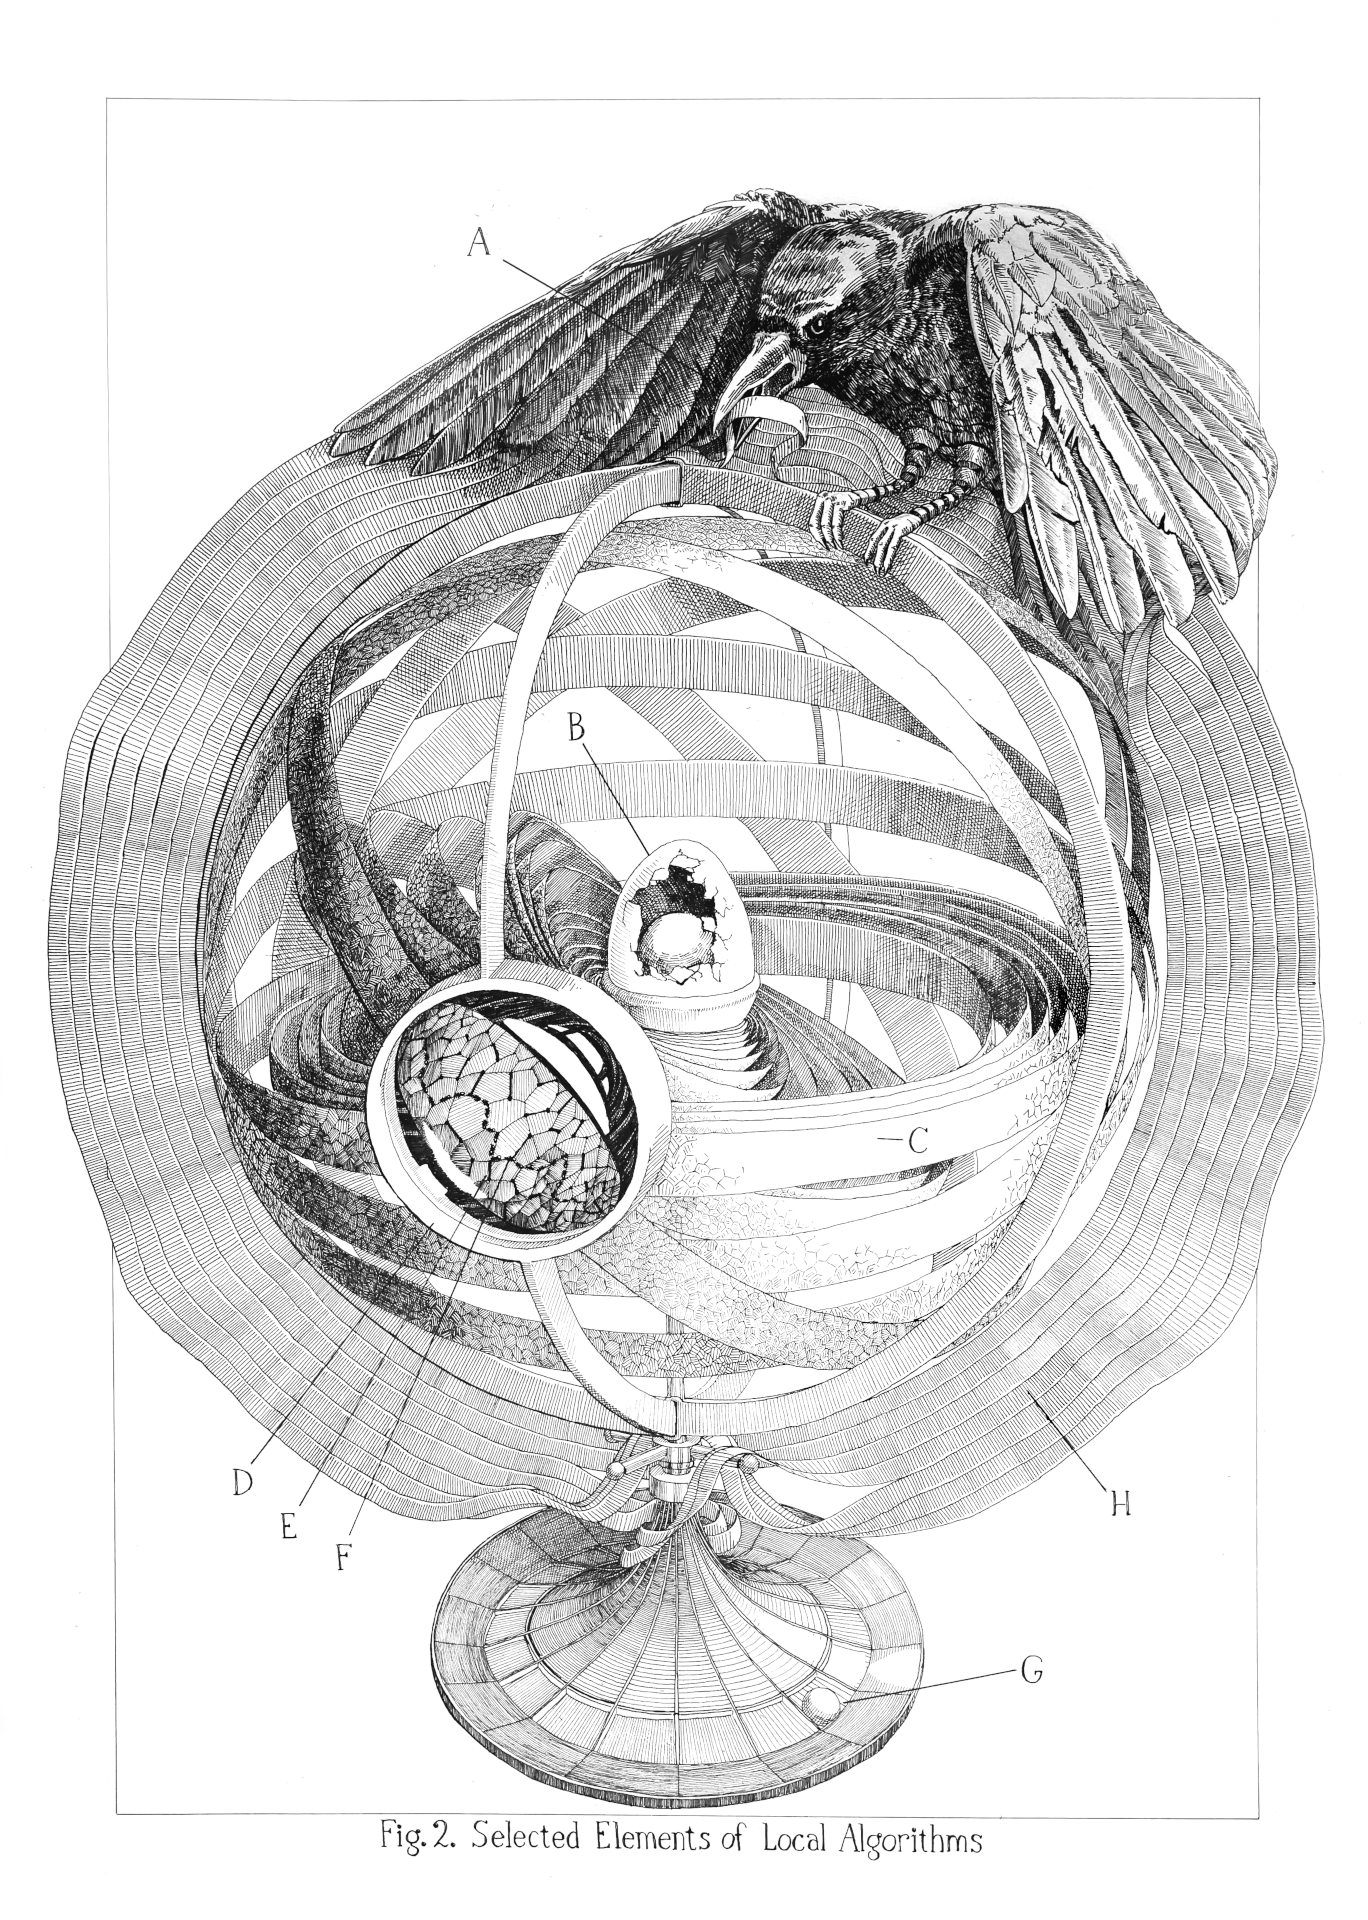


Fig. 2. Selected Elements of Local Algorithms. August 2026.
I made this poster for the 10th anniversary of the Workshop on Local Algorithms (WoLA 2026).
The drawing is intended to evoke a certain sense of mystery. If you cannot abide by this, then here is some explanation.
As a whole, the composition is based on a motif of concentric circles, intended to evoke local neighborhoods and metric spaces, a motif also of local algorithms.
The drawing is captioned “Fig. 2” for a few reasons; one reason is to help create the sense of mystery and coax the viewer into imagining the drawing as part of a larger expository textbook. Another reason is that the drawing is not intended to illustrate every important element of local algorithms. In case anyone is upset that there is something important about local algorithms which is not represented here, don’t worry! It is in Fig. 1!
A: Queries. I wanted to include an animal as one of several homages to the great M.C. Escher, whose work often featured animals interacting with abstract mathematical shapes (I was inspired by his work Stars in particular). I chose a crow for several reasons.
The first reason is that I wanted a bird, because birds pecking at food reminds me of query algorithms! The crow here is pecking at an input tape; 1 peck = 1 bit. So this is the first “element of local algorithms”: queries.
The second reason is that, while crows in artwork often have a sinister connotation, I personally associate birds (and corvids in particular) with intelligence and playfulness. I often include birds or birdlike features in my mathematical art to symbolize these qualities.
The third reason is that a bird helps tie together elements B (the egg; birds lay eggs, though this particular egg is far too large for that bird) and F (the ants; birds eat insects, though I am not sure if crows eat ants). Finally, crows simply look great in black ink.
B: Property testing. The egg at the center represents property testing. I do not know the origin of the “egg diagram” which is often used in presentations about property testing, but I attribute it to Clément Canonne; the yolk is the property, the white is the epsilon-close neighborhood, and everything outside it is what the algorithm should reject.
C: Streaming inputs. The tape represents an input tape, and there is supposed to be only one continuous input tape in this drawing, to indicate that it is streaming in one direction. However, if you look closely, you will see it is not continuous, for the mundane reason that it takes way too long to draw mathematically accurate ellipses and link them up into one stream, while also arranging them in a visually pleasing way. I had to give up on accuracy in order to finish the drawing in a reasonable time.
D: Local views. A magnifying glass, giving a “local” view of the input tape, which is revealed to have a graph on it. This was taken directly from the existing WOLA logo, featuring a graph viewed through a magnifying glass.
E: Matchings. A bit difficult to see here, but there is a matching on the graph that is revealed inside the magnifying glass. Finding matchings is one of the most well studied graph streaming problems, so it made sense to put this on the input stream. Matchings are also important in monotonicity testing, one of the most well studied problems in property testing. If I had been thinking more clearly, I would have made it an induced matching; alas, I did not, and the drawing is suboptimal.
F: Distributed algorithms and communication. Again hard to see, but there is a line of ants marching along the edges of the input graph. Ants remind me of local algorithms because they exhibit complex behaviours and solve problems with communication between simple(?) agents. The ants marching up the input tape also give the crow a reason to be pecking at it. Yet another homage to Escher, this time Mobius Strip II, also featuring ants marching along a tape.
G: Randomness. The whole device in the drawing (that is, the globe), represents an algorithm, and its foundation is a roulette wheel representing randomness. The roulette wheel is not depicted entirely accurately (for example it is missing the large rim with the track for the ball), so it may not be so easy to recognize. This insufficiency is because I was drawing this part at 10pm on the night before the deadline to digitize it. Also, I did not have a plan for this part of the drawing in advance; I inked the rest of the drawing while hoping that I could improvise the bottom part when I got to it. So, one might say even the drawing itself was not deterministic!
H: Huge inputs. The input tape extends beyond the globe, just as the input to a local algorithm extends beyond the storage capacity or knowledge of the computational device.
The diagrammatic labelling of elements was inspired by the absolutely gorgeous illustrated diagrams of Robert Hooke in Micrographia, one of the greatest feats of scientific illustration ever achieved.
The style of the figure is inspired textbooks of the late 1800s, particularly the 1875 textbook Astronomy by Jean Pierre Rambosson; do look at Fig. 3 of that textbook.
The drawing is captioned “Fig. 2”, and the labelled elements are not explained within the drawing itself, with the goal of invoking a certain sense of mystery that I don’t have the words to explain, but my favorite example is Albrecht Dürer’s Melencolia I. This is also where I got the idea of the caption “Fig. 2” (is there a Melencolia II?). I also enjoy the juxtaposition of a figure which looks like it is intended to explain something clearly, and which appears to have an internal logic, but which is completely incomprehensible.
Finally, one more small detail: is anyone surprised by one more homage to Escher? See Rind reflected in the crow, which unravels into the input tape.

Pen: Platinum 3776 Century (UEF nib)
Ink: Lamy Black
Paper: Canson